To better understand the motor transport industry in 2024, we examine key trends such as the freight cycle, fluctuations in trucking businesses, truck units entering and exiting the market, mergers, bankruptcies, contract and spot market rates for freight hauling, as well as other important factors like rising operating costs, driver shortages, and the broader economic outlook. The trucking industry is often a lead indicator for economic cycles, entering downturns ahead of other sectors and recovering first during economic upswings. Truck transportation plays a crucial role in supply chains for industries like manufacturing, retail, construction, and services.
Truck Freight Shipping in 2024
Truck freight shipping costs face an uncertain future. Current data shows that costs continue to rise while the dollar-per-mile hauling rate remains low. Truck freight rates fell below $2.00 per mile in late 2022, down from an average of $2.70 per mile earlier in the year (equivalent to $0.12 per ton-mile), and today they are stuck around $1.60 per mile.
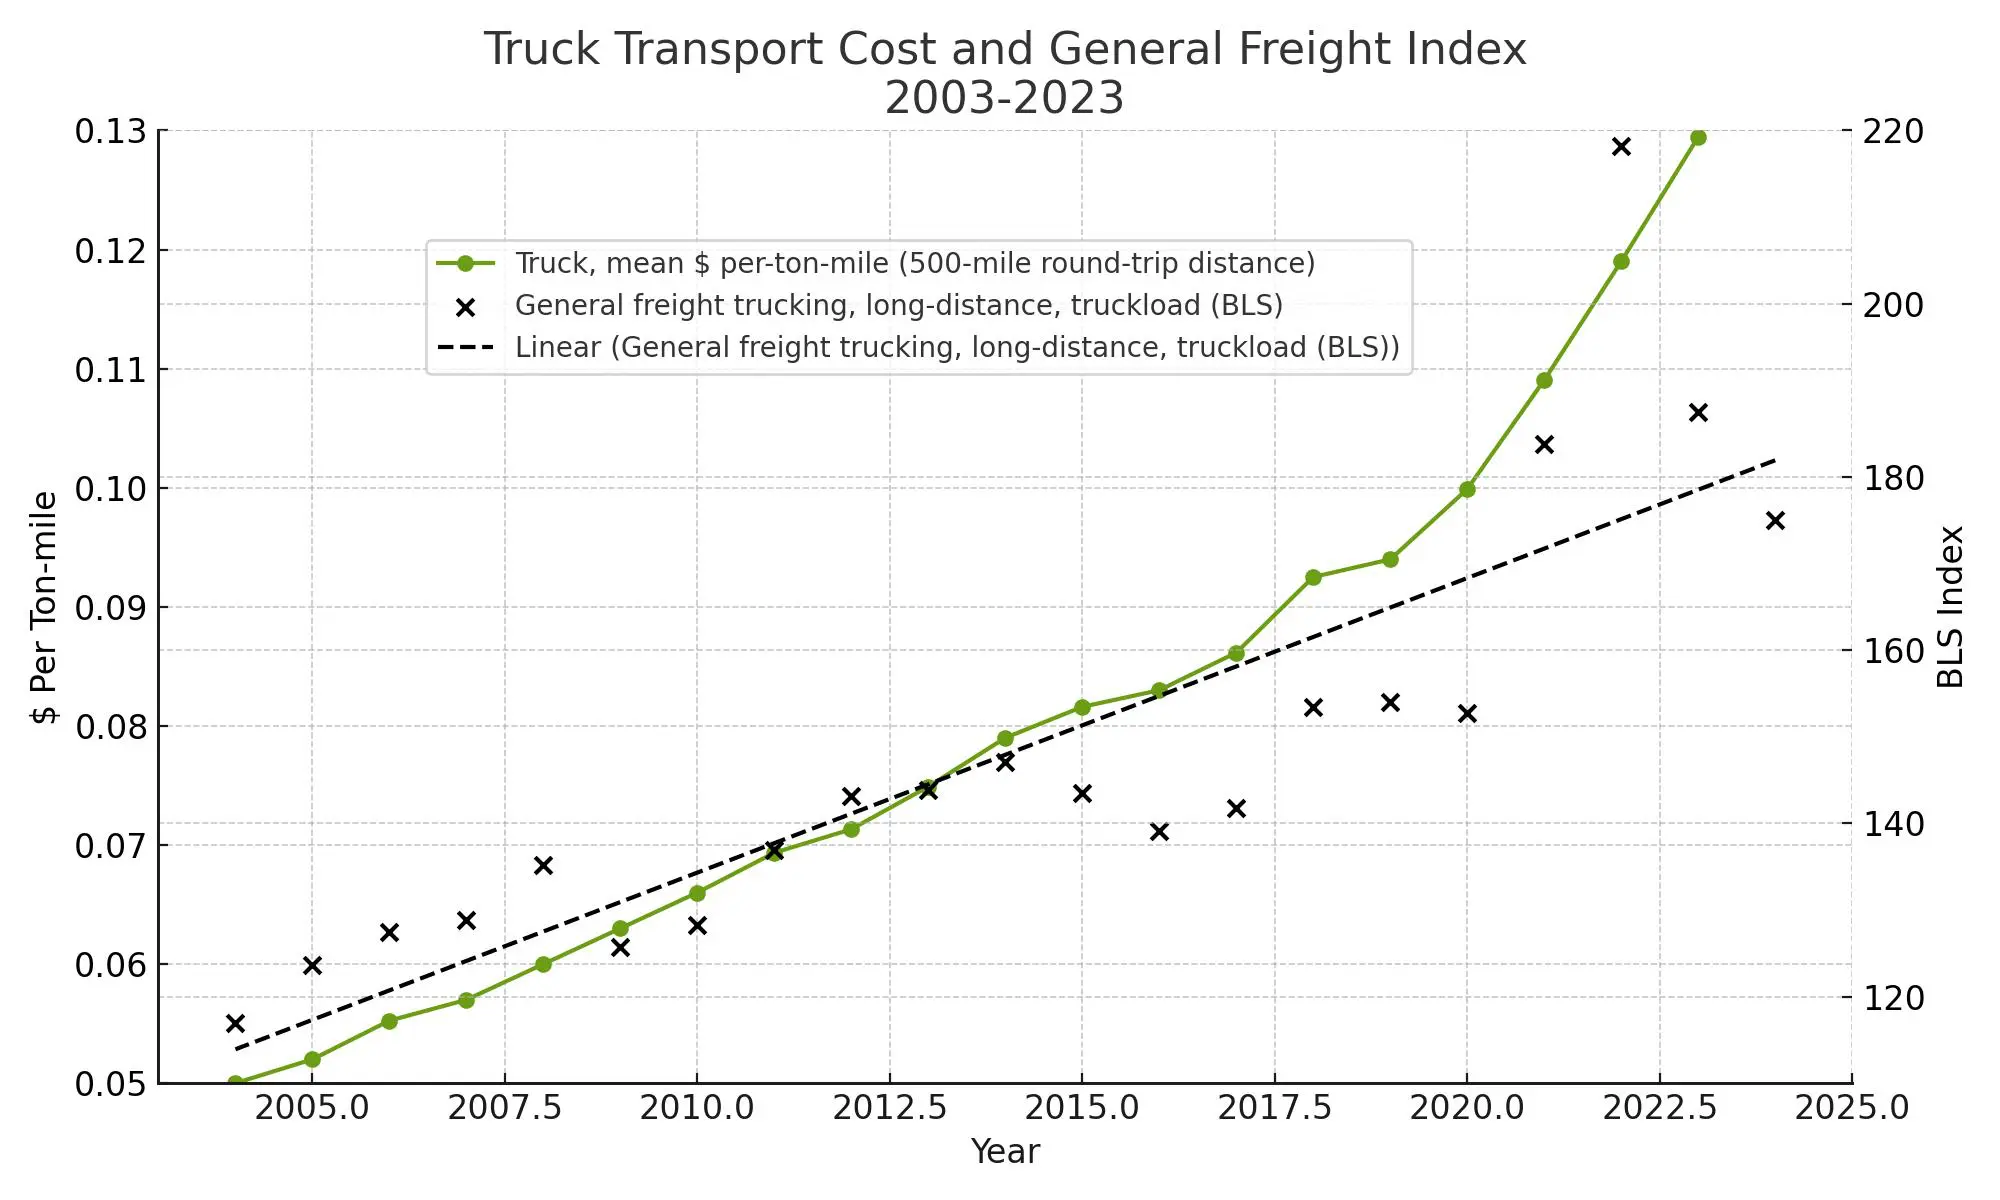
Figure 1 presents trends in trucking by comparing data from Costmine’s transportation expert with the U.S. Producer Price Index (PPI) for the long-distance trucking industry, as published by the Bureau of Labor Statistics (BLS). Costmine data for 2023-2024 is unavailable, but the upward trend of the BLS and Costmine data in 2021-2022 suggests a divergence from typical patterns. The sharp peak in freight costs during 2022 raises questions about whether rates will return to the long-term trend of $0.095 per ton-mile. A least squares curve (black, dotted) represents the linear trend for PPI data.
Figure 1. Truck transport costs and cost index for general freight
The truckload rates quoted are truckload units transporting average 22.5 tons (45,000 lbs. or 20.4 metric tonnes)
What is the Producer Price Index (PPI)? The PPI measures the average change over time for selling prices received by domestic producers. The PPI for truckload includes the first commercial transaction for its products and services. Data from Bureau of Labor Statistics is the producer price index published by Bureau of Labor Statistics.
In a related article in July Costmine reported unusual rate increases during the post-Covid period for rail transport with rail shipping costs increasing more rapidly than trucking rates. Rail rates reached $0.16 per ton-mile and $0.196 per ton-mile for 1,000- and 500-mile shipping distances respectively[1]. Costmine also issued an update of August 2024 for the motor carrier transportation industry, a chapter of Costmine’s Mining Cost Service (www.Costmine.com)
Costmine Intelligence issues annual reports about transportation with these reports addressing the status and costs about topics that affect transportation in the mining business. Topics include trucking (motor freight), rail and maritime freight with the updates published each year. These reports are found in Costmine’s Transportation chapter, a part of Costmine’s Mining Cost Service.
[1] https://www.canadianminingjournal.com/featured-article/Costmine-are-rail-transport-costs-really-four-times-higher/
1. The Trucking Freight Cycle is Improving (Source: Taube, Truckingdive.com)
Data from the Federal Motor Carrier Safety Administration (FMCSA) shows significant industry disruption beginning in 2020, with major adjustments since then. The 10-year history (Figure 2) reveals the addition and removal of truck units, with a net change over time. According to Truckingdive.com, the activity reached its lowest point in 2023, but is showing signs of recovery in 2024, as fewer trucks are being removed from service. The increase in truck unit additions signals an industry on the mend. (Data: US Dept. of Transportation FMCSA-data-UKMXA.csv).
Figure 2. Change of truck units, 2015 – Present
- What’s Happening Across Truck-Hauling Categories (Source: DAT freight and analytics, DAT.com)
Rates across national linehaul trucking categories—dry van, refrigerated (reefer), and flatbed—experienced low spot rates starting in 2017. After a brief recovery, rates dropped again in 2022 due to persistent challenges. Per-ton rates for both contract (long-term) and spot hauls show the following:
- Dry van contract rates have remained stuck between $1.50 and $1.60 per mile since December 2022, down from $1.75 to $2.50 per mile in mid-2022. Currently, spot rates are $1.96 per mile (September 2024).
- Refrigerated spot rates have stayed steady at $1.97 per mile throughout 2023 and 2024, following a drop from above $2.25 per mile in early 2022.
- Flatbed rates have erased all recent gains, now averaging $1.97 per mile. Similar to other categories, flatbed rates have fallen from their 2021-2022 highs.
Figure 3. Truck spot rates by type in $ per mile (BTS, August 2024)
(U.S. Dept. of Transportation, Bureau of Transportation Services, Truck spot rates from DAT.com, https://www.bts.gov/freight-indicators#non-farm)
For small carriers and owner-operators running 100,000 loaded miles and 15,000 empty miles annually, the national dry van breakeven operating cost was just over $1.79 per mile as of August. With local dry van spot rates averaging $2.01 per mile, the estimated gross profit per mile stands at approximately -$0.03/mile, resulting in a yearly loss of around $3,000. This is a stark contrast to the $64,000/year gross profit in 2021 and highlights the difficulties faced by smaller fleets. Losses in 2019 were $0.02 per mile, making today’s market one of the most challenging since 2018 (Source: Dat.com Dry Van Report, Sept. 2024).
On the positive side, some carriers can operate at lower rates due to reduced operating and debt costs. Small carriers are now able to run at $1.43 per mile, compared to larger carriers with financing costs adding up to $0.36 per mile.
The COVID-19 pandemic caused a significant fluctuation in spot and contract dry van rates starting in 2020, with a sharp rise in spot rates followed by a steep decline (Figure 4). Contract rates experienced less volatility but also declined. Spot rates plummeted from mid-2021 to mid-2022, bottoming out in April 2023, and have only recently begun to rise again. Year-over-year changes in spot rates typically lead contract rates by six to nine months, but it remains uncertain if today’s figures indicate a return to normal market conditions.
Figure 4. Trucking spot rate versus contract rate (year-over-year)
A comparison between contract rates and spot rates, known as the dry van spot market indicator, sheds light on whether the market is expanding or contracting. An indicator within -10% to +10% suggests market expansion, while anything greater than 15% signals contraction. Currently, the indicator stands at 19%, and dry van spot rates have been in negative territory for 27 consecutive months—well beyond the typical 19-month cycle. A return to normal market conditions is not expected in the near future.


